Free • No signup Fix Case study photos · Free

Fix Low-Quality Case Study Screenshots and Photos

Blurry screenshots and pixelated graphs kill case study credibility. Fix them fast.

Blurry pixelated analytics screenshot with unreadable metrics
Before
Enhanced screenshot with clear readable data and metrics
After

Fix Low-Quality Case Study Photos

Drop your photo here

or click to browse

Release to upload

Free • No signup

Advertisement
Popular use cases:
  • Case study screenshots
  • Low quality case study photos
  • Blurry analytics screenshots
  • Pixelated charts
  • Dashboard screenshot enhancement
  • Before after comparison quality
  • Professional presentation visuals

Cost
Free No signup required
Time
Instant results in 15-30 seconds
Works on
Any device - browser, phone, tablet, desktop
Powered by
AI-powered photo editing
Scenario Prompt Time
Blurry screenshot enhance screenshot quality, sharpen text and improve clarity 15s
Pixelated analytics reduce pixelation, ensure numbers and text readable 20s
Low-quality chart enhance chart quality, improve line clarity and readability 15s

How it works

  1. Upload low-quality case study visual

    Drop your blurry screenshot, pixelated chart, or low-res photo into EditThisPic. JPG, PNG, WebP up to 7MB. Works with analytics screenshots, before-after comparisons, dashboard captures, product demos—any visual documentation for case studies or presentations.

    Expect: Simple screenshot enhancement: 15-20 seconds. Severely compressed or very low resolution: may need stronger processing.
  2. Describe the quality issue

    Type 'enhance screenshot quality for professional case study' or 'sharpen and improve this low-quality image, make it presentation-ready.' The AI reduces blur, enhances text readability, improves chart clarity, and makes low-quality visuals suitable for professional documentation.

    Tip: For screenshots with text, add 'ensure all text is sharp and readable' to prioritize text clarity—critical for analytics dashboards and metrics.

    Copy one of these to get started:

    Blurry screenshot needs sharpening for case study enhance screenshot quality for professional case study, sharpen text and improve clarity
    Analytics dashboard screenshot is pixelated reduce pixelation and enhance resolution of analytics screenshot, ensure all numbers and text are readable
    Chart or graph has poor quality enhance chart quality for professional presentation, improve line clarity and text readability
    Before-after comparison photos look unprofessional enhance both images to professional presentation quality, ensure comparison is clear and credible
    2 more prompts
    Screenshot exported from Slack or Teams has compression remove compression artifacts from messaging platform screenshot, enhance to professional quality
    Mobile app screenshot needs clarity improvement enhance mobile app screenshot resolution and sharpness, ensure UI elements are clearly visible
  3. Verify data accuracy and readability

    Check that numbers, metrics, labels, and chart elements are clear and accurate. Enhancement should make existing data more readable, never alter values or create false information. Case study credibility depends on data accuracy.

  4. Optimize for presentation medium

    If creating slide decks, PDFs, or web case studies, specify the output format: 'enhance for PDF presentation' or 'optimize for web case study viewing.' Different mediums have different quality requirements.

    Tip: For critical case studies, enhance all visuals with the same prompt to maintain consistent quality across the entire presentation.
Try it free

Fix Low-Quality Case Study Photos

Drop your photo here

or click to browse

Release to upload

Free • No signup

"Our case studies had blurry before-after screenshots that looked unprofessional. Enhanced everything and now our results documentation looks credible." @AgencyResults

See it in action

Blurry pixelated analytics screenshot with unreadable metrics
Before
->
Enhanced screenshot with clear readable data and metrics
After

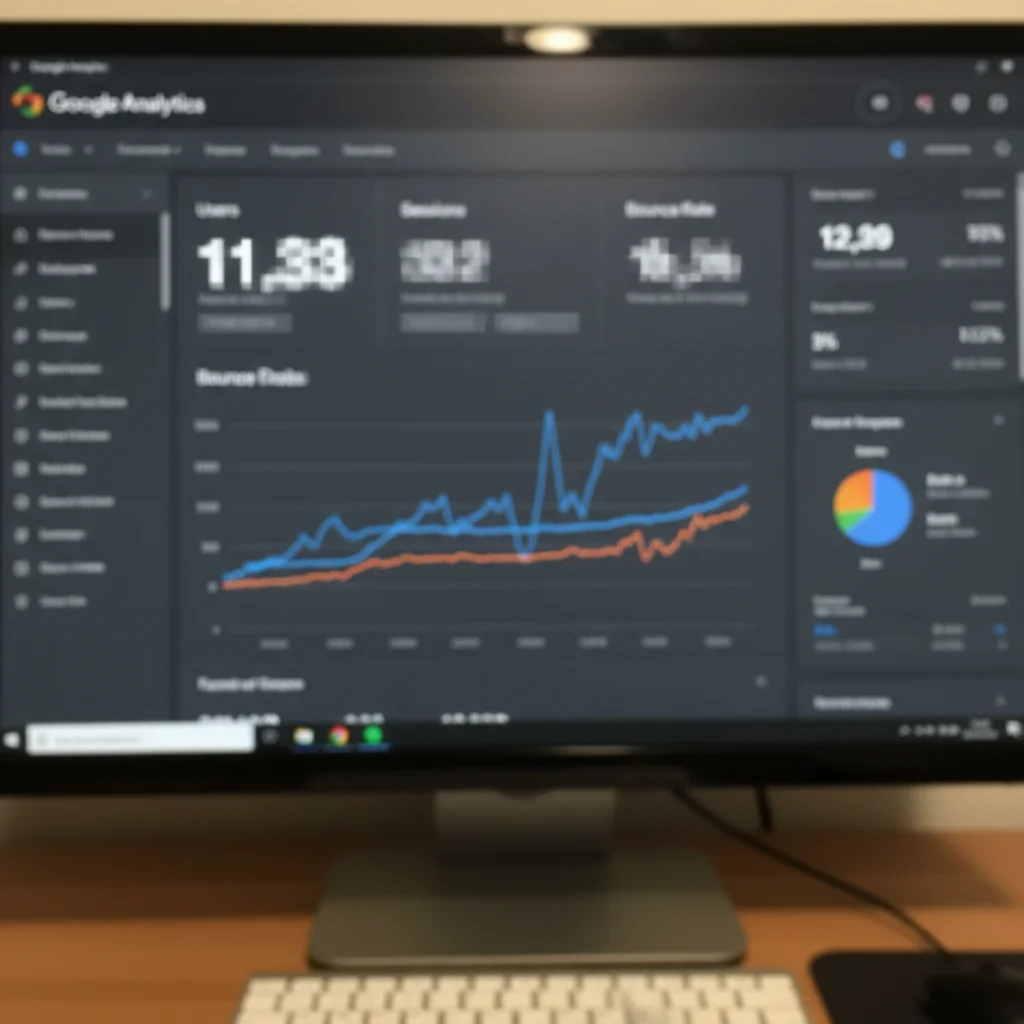
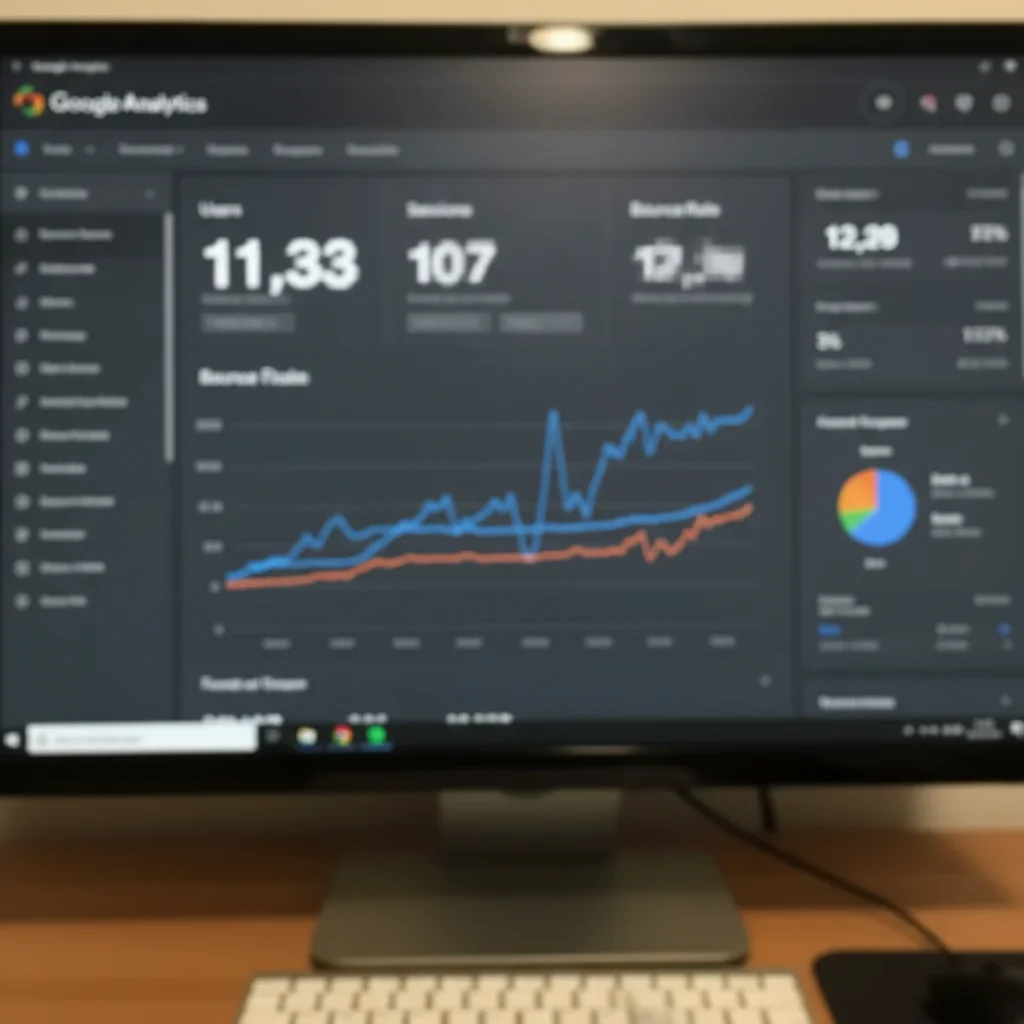
Google Analytics screenshot enhanced for case study

Agency case study showing traffic growth had blurry GA4 screenshot. Enhanced to make metrics clearly readable for client presentation.

Prompt: reduce pixelation and enhance resolution of analytics screenshot, ensure all numbers and text are readable
Low-quality before-after product screenshots
Before
->
Enhanced clear comparison showing product improvements
After

Before-after product comparison clarified

SaaS case study showing UI improvements had low-quality before screenshot. Enhanced both images to professional quality showing clear transformation.

Prompt: enhance both images to professional presentation quality, ensure comparison is clear and credible
Blurry pixelated Excel chart screenshot
Before
->
Enhanced sharp chart with clear data visualization
After

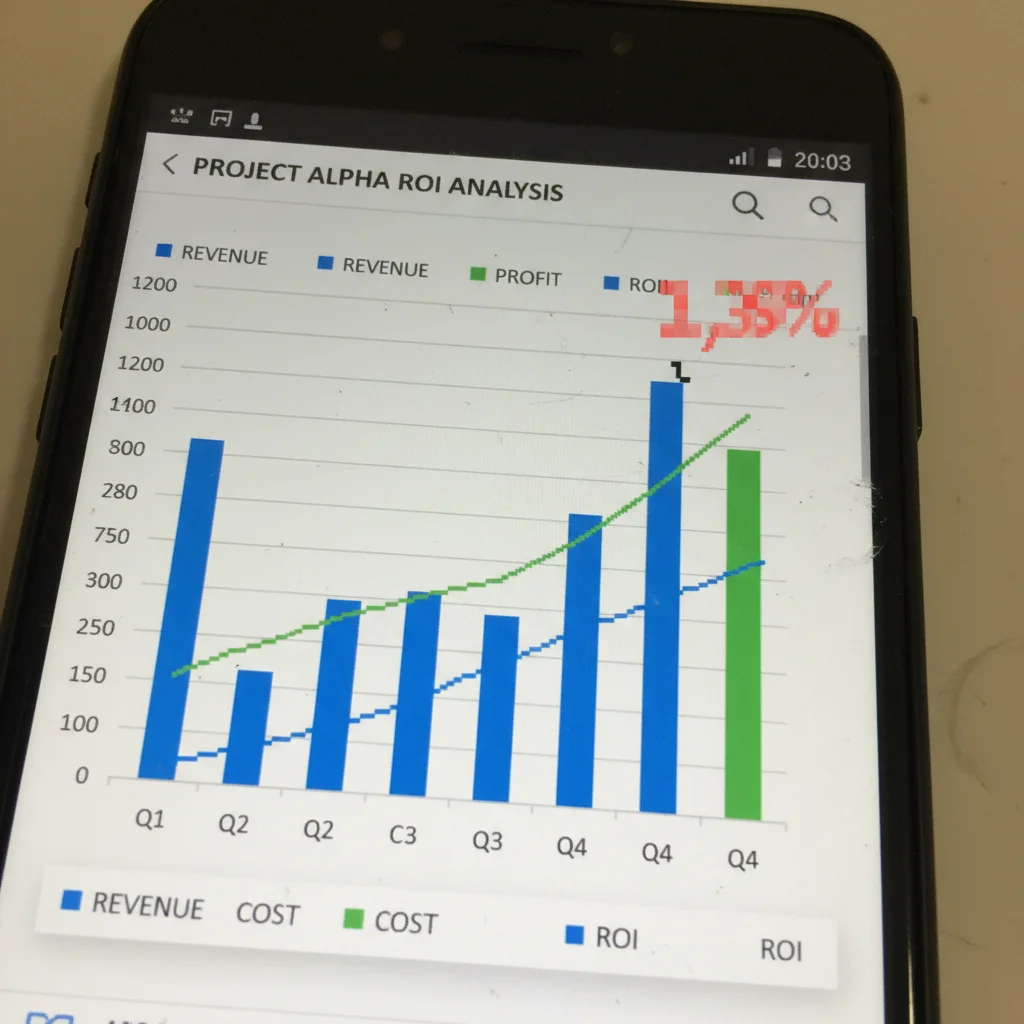
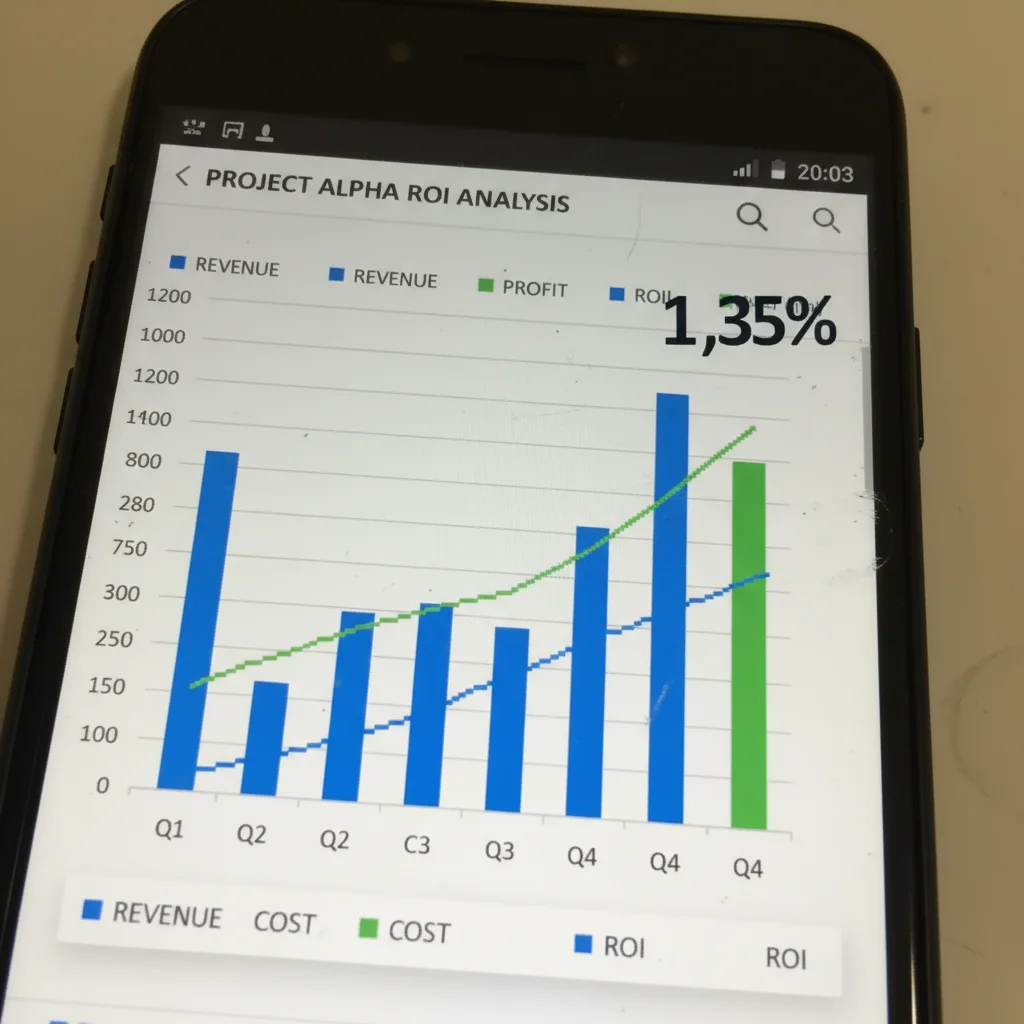
Client results chart made presentation-ready

Consultant's ROI chart screenshot from Excel was blurry and pixelated. Enhanced for inclusion in PDF case study sent to prospects.

Prompt: enhance chart quality for professional presentation, improve line clarity and text readability
Advertisement

If something looks off

Enhancement created artificial-looking results or visible artifacts

Why: Over-processing severely degraded sources can create unnatural appearance or introduce processing artifacts.

Try: enhance naturally without over-processing, improve clarity while maintaining realistic appearance

Tip: If source is too degraded, consider retaking the screenshot rather than over-enhancing to artificial levels.

Text became less readable or distorted after enhancement

Why: Aggressive sharpening can create halos or distortion around text edges, reducing clarity.

Try: enhance overall quality with careful text sharpening, ensure text remains clean and readable

Tip: Text clarity is priority one for case studies—verify readability always improves, never degrades.

Numbers or data values appear to have changed

Why: Enhancement should never alter actual data—if numbers look different, the processing was too aggressive.

Try: enhance image quality only, do not alter any numbers, metrics, or data values

Tip: Data accuracy is non-negotiable. Always verify all metrics and values remain exactly as original.

Colors shifted making charts or graphs inaccurate

Why: Color enhancement can change how chart colors appear, potentially confusing data visualization.

Try: enhance clarity and sharpness but preserve accurate chart and graph colors

Tip: Chart colors often have meaning (red for negative, green for positive)—preserve color accuracy.

Screenshot size increased file size too much for presentation

Why: Enhancement can create large files unsuitable for email or certain presentation platforms.

Try: enhance quality while maintaining reasonable file size for presentations and documents

Tip: After enhancement, compress appropriately for your delivery medium (PDF, slides, web).

Enhanced screenshot still looks unprofessional

Why: Some sources are too degraded to fully recover—enhancement has limits based on source quality.

Try: maximize enhancement within technical limits of the source quality

Tip: If enhancement isn't sufficient, retake the screenshot at higher quality if possible.

Quick answers

Do I need to mark areas before enhancing case study screenshots?

No! Just describe the quality issue: 'enhance screenshot quality' or 'sharpen and improve clarity.' The AI processes the entire image automatically. Markers are only needed if specific areas need different treatment—like if one chart needs more enhancement than others in the same screenshot.

Why do case study screenshots look low quality?

Screenshots often have compression artifacts from being exported, emailed, or saved multiple times. Platform screenshots (Slack, GA4, dashboards) automatically compress. Screen resolution mismatches cause blur. Enhancement fixes these technical issues that make your data and results look unprofessional. Clear visuals make case studies credible.

Will enhancement change the data or metrics in my screenshots?

No, when prompted correctly. Specify 'enhance quality only, do not alter data or numbers.' The AI improves visual clarity—sharpness, resolution, readability—without changing actual values, metrics, or chart elements. Always verify data accuracy after enhancement. Any changes to actual data mean the processing was wrong.

Can this fix screenshots exported from Slack, Teams, or email?

Yes. Messaging and collaboration platforms compress images heavily. The AI can reduce compression artifacts, improve sharpness, and enhance text readability. This is critical when your only copy of important case study evidence is a compressed platform export. Specify 'remove compression artifacts' for best results.

How do I maintain consistent quality across all case study visuals?

Use the same enhancement prompt for all screenshots, charts, and photos in your case study: 'enhance for professional presentation, improve clarity.' Consistent processing creates cohesive visual quality across the entire document. Mixing enhanced and unenhanced visuals looks unprofessional—update everything to the same standard.

Ready to fix your case study screenshots?

Free to try. No signup required.

Try it free